How to Use Iconosquare to grow your Instagram
Last week we focused on the benefits of hashtags and how they can help us grow our Instagram following and increase engagement.
Now how do we know if the techniques we incorporate are actually working? If we decided to use a different set of hashtags or post at night instead of early evening, how do we know if it’s actually working better than before? We need to have a way to be able to track and analyze our data.
That’s where Iconosqaure comes in:
Using Iconosquare
Iconosquare was created to help users have complete control over their Instagram along with:
– Promotion
– Manage and engage their community
– Analyze activity and provide informative statistics
There used to be a free version, but they recently switched it to a 7-day free trial. Paid version is $28.80/year, which is small investment considering how much I use it weekly.
I really want to dive into Iconosquare and the various sections on how to collect and use the data to help grow our Instagram following.
How to interpret your Analytics
Here is where all the fun starts, what good is the data if we don’t know how to interpret and use it to our advantage?
On the top of the page click Analytics and you will be taken to the Overview page.
Overview: This provides a basic overview of your Instagram account along with the Last 7 Days follower growth and Engagement stats for your latest post.
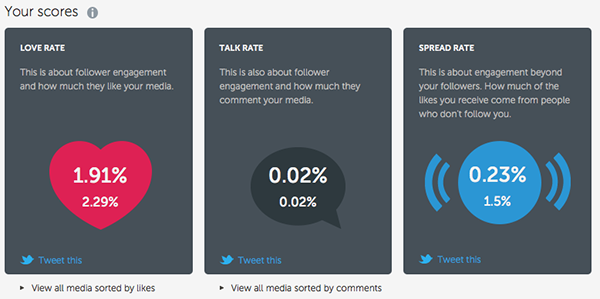
One thing to keep in mind when reviewing this section: the larger number is what you received on your last post, the smaller number is an average of the last 15 posts. My Love Rate and Spread Rate was slightly lower on my latest post based on the average of the last 15.
A hidden gem within this section that is very revealing is…under the Love Rate box there is a link titled “View all media sorted by likes.” Click it and you will be taken to your posts sorted by the number of likes.
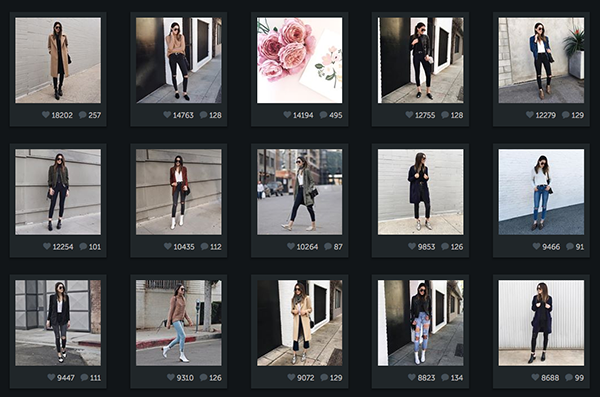
Notice anything trending? Full body alert! My most liked content by far are my full body outfit shots. This tells me that my audience responds well to this type of content and why I try to make it a point to post one full body photo a day.
Rolling monthly analysis: This will provide me data for the last rolling month…meaning since I pulled this data on Feb 9th, it will provide me data from Jan 10th-Feb 9th.
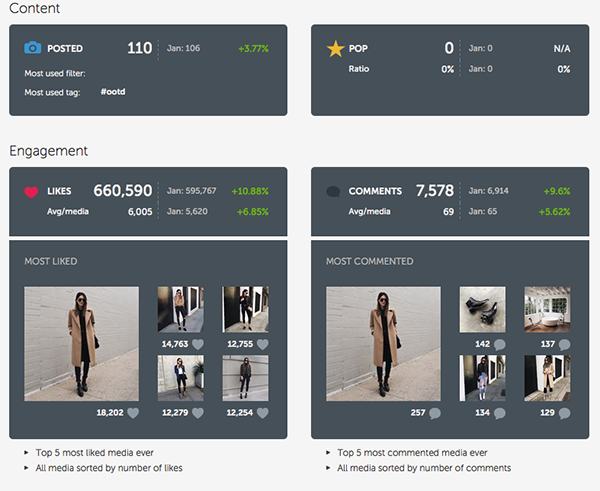
This tells me that my engagement rate has increased from the previous month, which is great! It’s a way for me to track if the content I’m posting is resonating more with my followers.
If you notice engagement rate decreasing, I would suggest to go back to the most liked photos and try to incorporate those more within your content. But remember to do it in moderation, not every one of my posts is a full body… I aim for a well rounded feed.
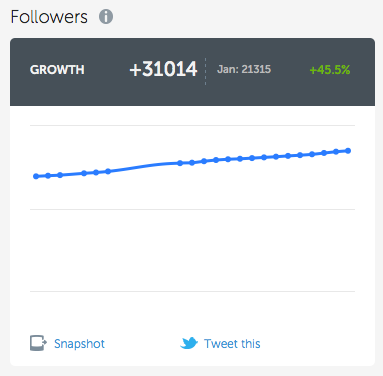
Before Iconosquare, I would manually track the amount of followers I gained daily on an excel sheet. I wanted to make sure I was posting content others liked and wanted to follow. This report has saved me tons of time. As you can see, I increased my follower rate by +45.5%. This provides more indication that I’m on the right track with my audience regarding the content I’m posting.
Also, I believe the increased engagement rate we saw earlier correlates to the amount of followers I gain.
Content: Truthfully, I don’t really use this section. I post consistently 3-4 times a day everyday. This section shows how much content you’ve posted throughout the years, daily density, most used filter and hashtag.
I can see it beneficial for someone who is having a hard time posting throughout the day and would like to improve on it, this data would show your posting habits.
Engagement: Provides an average like/comment per media growth history bar chart. Also your top liked and commented photos.
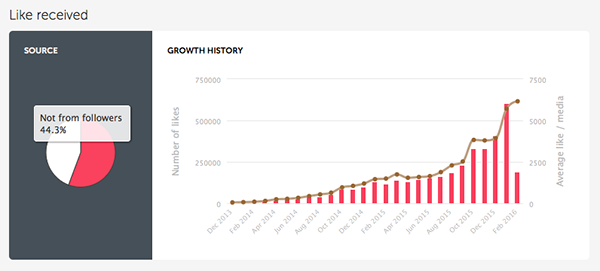
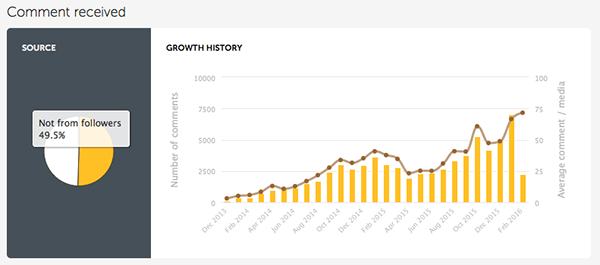
If you were ever skeptical about my post last week on using hashtags, look at the data above. Almost half my likes and comments are from people who don’t follow me! I understand that there’s other ways to get likes/comments from non-followers, like being in the explorer page, but I would have to think a good majority is based on the hashtags I use.
Optimization: My favorite section. Provides data on best posting times, filter impact and top hashtags.
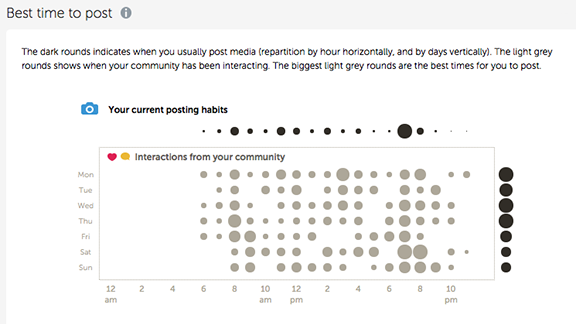
I believe that by really honing in on my most optimal posting time has stepped up my IG game. I have seen major improvements on engagement and follower rates based on hitting those key optimal times.
My most popular posting times:
Mon-Fri: 9-10am, 2:00-4:00pm, 7:45pm
Sat – 12pm, 7pm
Sun – 10am, 1pm, 7:45pm
The times above seem to work best for my audience, but may not fit yours. You don’t want to become too analytical as trends/habits tend to change over time. As you can see, these times have changed from the last time I spoke about posting habits.
Trial and error is the best approach to really finding out which days/times work best.
There you goooo, that’s how I use Iconosquare weekly and I would suggest you check it out and see how it works for you as well- comment below with any cool trends you noticed from analyzing your data 🙂
I’m off for NYFW fittings before shows start tomorrow!
xx Brittany
